Managing CRE Comps in Spreadsheets: When Your File Starts to Break


Most brokers will tell you their comp spreadsheet works fine. They are usually right, for now. Managing CRE comps in spreadsheets holds up well at first, which is exactly why the failure catches people off guard. The file does not break all at once. It breaks at predictable thresholds, and the trouble is that you cannot see the next one coming until you are already past it.
Psychologists have a name for this blind spot. Normalcy bias is the tendency to assume things will keep working the way they always have, which leads people to discount warning signs and delay action right up until a problem becomes a crisis. It is well documented in disaster research, where people underestimate a threat because nothing has gone seriously wrong yet. Your comp file triggers the same instinct. It worked yesterday, so it will work tomorrow, so why look closer.
Below, we map the thresholds so you can look closer. You will see the specific failure modes that show up at 50, 200, and 500 comps, so you can check your own file against them instead of guessing. The point is not that spreadsheets are bad. The point is knowing exactly when yours will start to fail and what that failure looks like.
The False Confidence Problem
Ask ten brokers how their spreadsheet is holding up and most will say it is working great. The reason is simple: they have not hit the next threshold yet. A file with 60 comps behaves nothing like a file with 400, but the broker at 60 has no way of knowing what is coming.
This is why spreadsheet failure feels like bad luck rather than a pattern. A sort scrambles a column one afternoon. A formula returns the wrong number three weeks later. A teammate emails back an outdated version. Each event looks like a one-off bug, so you fix it and move on. You never connect with them because they arrive too far apart to feel related.
They are related. They are the same structural problem showing up at different sizes. Once you see the thresholds, the random bugs stop looking random.
This Is Not a Small-Broker Problem

It would be easy to read all of this as a skill issue, the sort of thing that only happens to brokers who are not careful with their files. The record says otherwise. In 2012, JPMorgan lost more than six billion dollars in the trading episode known as the London Whale, and the bank’s own investigation traced part of the failure to a risk model that ran through a chain of Excel spreadsheets, with data copied and pasted from one sheet to the next by hand. The internal review had flagged that the process should be automated. It never was. One formula divided by a sum where it should have been divided by an average, and the model quietly understated the bank’s true risk.
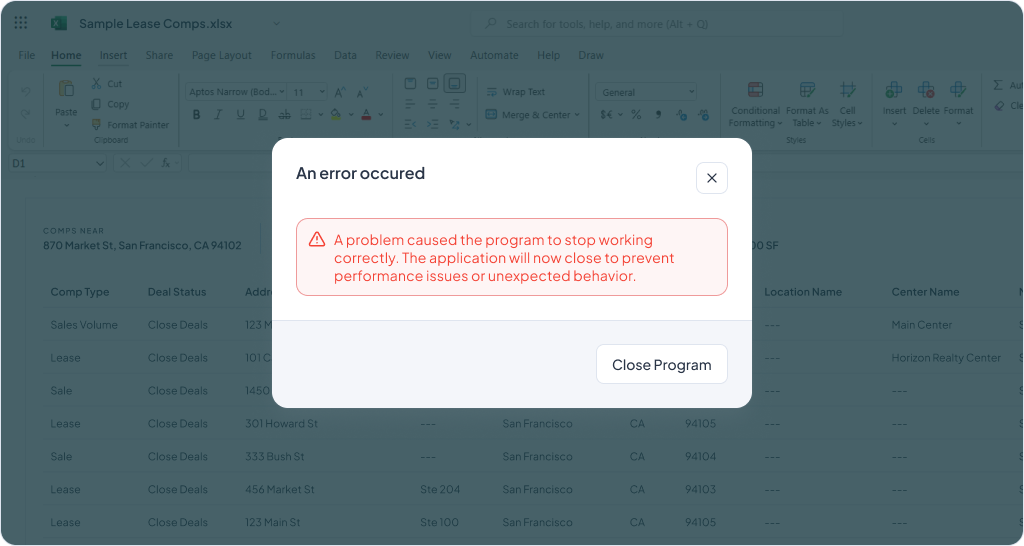
The lesson is not about banking. It is that spreadsheets fail silently. They do not warn you when a formula drifts or a paste lands in the wrong cell. They just hand you a number that looks right and is wrong. A team of quants at one of the largest banks in the world could not out-discipline that flaw, which tells you it is not a discipline problem. It is built into the tool.
At 50 Comps: Mostly Smooth, First Hairline CracksAt 50 Comps: Mostly Smooth, First Hairline Cracks
At around 50 comps, your spreadsheet is doing its job and doing it well. This is the stage where everyone falls in love with the tool, and for good reason.
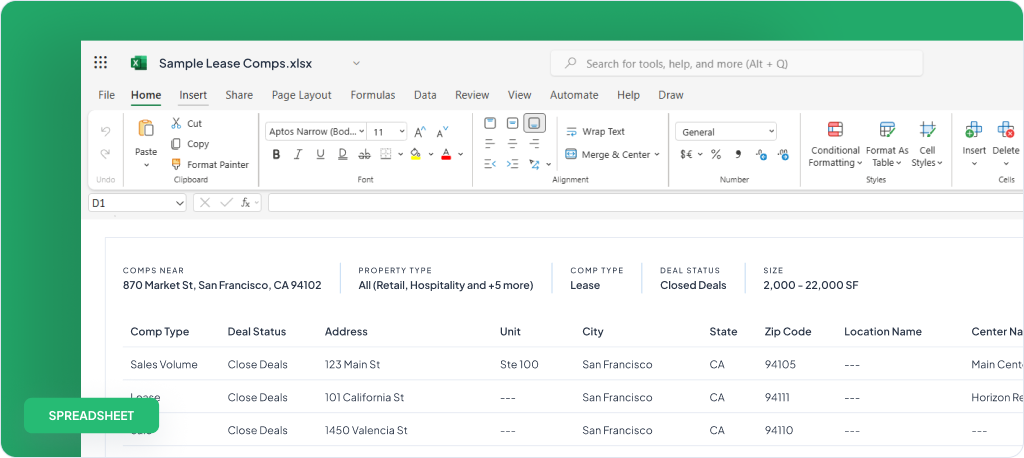
Lookups are fast. You can scan the whole sheet on one screen. Basic sorting by price per square foot rent, or market, or date works as expected. Conditional formatting highlights the deals you care about. If you need to find a comp, you will find it in seconds. Nothing about this size strains the format.
But the first hairline cracks appear here, and they are easy to wave off. You start deduplicating by hand, because you entered the same property twice under two slightly different addresses. You hit the occasional sort error, the kind where you sorted one column but forgot to extend the selection, so half your rows now carry the wrong data. You catch it this time. The worry is the time you do not.
These early cracks are minor. That is the danger. They train you to trust a file that is about to get much harder to manage.
At 200 Comps: Version Conflicts and Drifting Formulas
At roughly 200 comps, the cracks widen into real problems. This is where managing CRE comps in spreadsheets stops feeling effortless and starts costing you attention.
The version conflict problem arrives first. The moment a second person touches the file, you have two truths. One teammate edits the copy in their downloads folder while another edits the one in the shared drive, and now neither file is complete. You merge them by hand, or you do not, and a comp quietly goes missing.
Formulas start to drift. A calculated column that worked at 50 rows now misfires somewhere in the middle, because a paste pushed cells out of alignment, or someone inserted a row that the formula did not expect. The number still looks like a number, so nobody questions it.
The file also gets physically unwieldy. It is too large to email cleanly. It loads slowly on a laptop and becomes nearly unusable on a phone, which matters because you are often pulling a comp from your car or a client’s lobby. The tool that was built for your desk no longer travels with you.
At 500 Comps: Structural Breakdown
At around 500 comps, you reach structural breakdown. The failures are no longer occasional. They are the normal state of the file.
Formulas reference deleted rows. You cleaned up an old comp in row 12, and now a formula down in row 200 points at nothing and throws an error, or worse, returns a stale value. Tracking down which formula broke takes longer than the cleanup saved.
Loading slows to a crawl. Conditional formatting, layered up over years, starts to break or lag. Filtering becomes the real wall: you want every retail comp in one submarket that closed in the last 18 months above a certain price per square foot, and the spreadsheet cannot hold that many conditions at once without a workaround you have to rebuild every time.
At this size, the file no longer serves the work. The work serves the file. You spend your day keeping the spreadsheet alive instead of using it to win business.
The Hidden Cost Is the Maintenance, Not the Bugs

Here is the part brokers miss. The real cost is not the sort of error or the broken formula. Those are visible, and you fix them. The real cost is the time you spend maintaining the file and recovering from its failures, hour after hour, year after year.
It is the work that hides in plain sight:
- The deduplication you do every month
- The version you reconcile after a teammate’s edits
- The afternoon lost to hunting down why a number looks wrong
- The report you reformat by hand because the file cannot produce one
None of these show up as a single dramatic failure, so none of them get counted.
Add them up and the spreadsheet is one of the more expensive tools you own. You just pay for it in your own time, which is the one resource a broker cannot bill back.
The Structural Problem Behind All Three Thresholds
The three thresholds are not three separate issues. They are one issue at three sizes. Spreadsheets are not databases, and comp data is a database problem.
A spreadsheet treats every cell as independent. There is no rule that says this address belongs to this deal, or that this tenant connects to that lease. The structure lives in your head and in fragile formulas, not in the tool. That works at 50 records because you can hold it together by hand. It collapses at 500 because no person can.
A database treats records as records. Each comp is a single object with defined fields, relationships, and validation. You cannot accidentally sort one column out of step with the others, because the columns are not loose cells, they are properties of one record. You cannot point a formula at a deleted row, because the database manages those connections for you. The failure modes that define the three thresholds simply do not exist in this model.
So the question is not whether your spreadsheet will break. It is whether comp data ever belonged in a spreadsheet in the first place. The honest answer is that it did, right up until you crossed the first threshold.
What Brokers Move To, and Why

When the spreadsheet finally costs more than it saves, brokers move in three broad directions, each with a different tradeoff.
General-purpose databases
Tools like Airtable give you real record structure and stop the worst spreadsheet failures. The catch is that they are blank canvases. You build the comp model yourself, maintain it yourself, and learn a new tool that was never designed for brokerage work. You have traded a familiar problem for a flexible one.
Market data platforms
CoStar and similar platforms hold enormous datasets, but they solve a different problem. They sell you the market’s data, often including comps assembled from other brokers, and they can be expensive and thin on smaller submarkets. They are built to give you access to other people’s deals, not to manage the private history of your own closed transactions.
Private comp management software

A newer category, including Compstash, is built specifically for brokers who want to manage their own closed deal history without handing it to the market. The model keeps the flexibility brokers liked about spreadsheets and adds the structure they were missing. The full feature set is built around the failure modes above:
- Defined records that cannot drift out of alignment, so a stray sort never corrupts a column
- Map views that place every comp by location instead of a list of addresses
- Branded one-click reports filtered by submarket or deal type, in Excel and PDF, so you stop trimming and reformatting by hand before every client send
- Bulk upload to move your existing spreadsheet over without retyping
- Permission and export controls that decide exactly who sees which comps
The defining feature of this category is privacy. Your comps stay yours. They are never sold, aggregated, or resold to another broker, which is the trade you make when you put your deal history into a market platform. A private comp database lets you escape the three thresholds without giving away the data your business is built on, and a side-by-side comparison against spreadsheets, CoStar, and other tools makes the tradeoffs clear.
Brokers have tracked comps this way for a long time, from the spiral notebook to the spreadsheet to the database, a longer arc that runs all the way back to the Domesday Book. The tools change. What does not change is that your closed deals are the asset, and the asset deserves better than a file that breaks at 500 rows.
Where Your File Sits Right Now
Managing CRE comps in spreadsheets is not a mistake. It is the right call when you start, and it stays the right call until you cross a threshold you could not see coming. The mistake is assuming that because the file works today, it will keep working as your deal history grows.
Count your records and find your threshold:
- Near 50: watch for manual deduplication and stray sort errors
- Near 200: expect version conflicts and drifting formulas
- Near 500: you are likely already paying the maintenance tax, whether you have named it or not
When the spreadsheet starts costing you more time than it saves, a private comp database is built to take that weight off your desk while keeping your comps where they belong, with you.
Start a free trial of Compstash and keep the deal history you earned.